Let’s focus on generating meaningful value this time. We can always connect a different sensor or read information from the board. It is this data that is important to us. In this example, we will make a short application that simply reads data and displays it in the serial console. It’s nothing impressive, but they can be used for other more cool examples and serve us real data when testing wireless communication or scenarios where we need some simple numbers. The goal is to get real random values that are in a range and we can interpret and validate if they are meaningfully true. So let’s try to read the internal ESP32 CPU temperature sensor (T-Display-S3 ESP32). More information can be found here and here.
But let’s get started, open the Arduino IDE and start a new document from the File -> New. This will open a new sheet in the programming environment.
Copy and paste the following code into the file:
#include "driver/temp_sensor.h"
void initTempSensor(){
    temp_sensor_config_t temp_sensor = TSENS_CONFIG_DEFAULT();
    temp_sensor.dac_offset = TSENS_DAC_L2;
    temp_sensor_set_config(temp_sensor);
    temp_sensor_start();
}
void setup() {
  Serial.begin(9600);
  initTempSensor();
}
void loop() {
  float result = 0;
  temp_sensor_read_celsius(&result);
  Serial.print("Temperature:");
  Serial.println(result);
  delay(5000);
}
The initTempSensor function initializes the code and makes some basic settings. For more information about the individual parameters and functions, you can read the API Reference page. In the main loop function we can set a delay in milliseconds. Here it is chosen so that there is a 5 sec delay between taking the temperature value from the board. This is a relatively small value that generates multiple results. If we have a value that changes much more smoothly, we can choose a much higher value and thus use less memory to save if we store the values locally or less energy and less bandwidth if we transmit the results wirelessly.
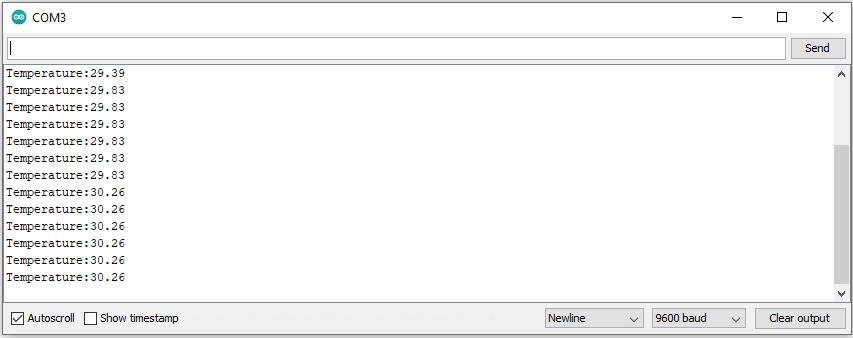
Upload the code to the board by pressing the “Upload” button (second button on the Arduino IDE, top left, green arrow in a circle). Wait for the upload indicator in the bottom right corner to finish and open the serial monitor (Tools -> Serial monitor). This way we can see the measured values in Celsius.
The values are:
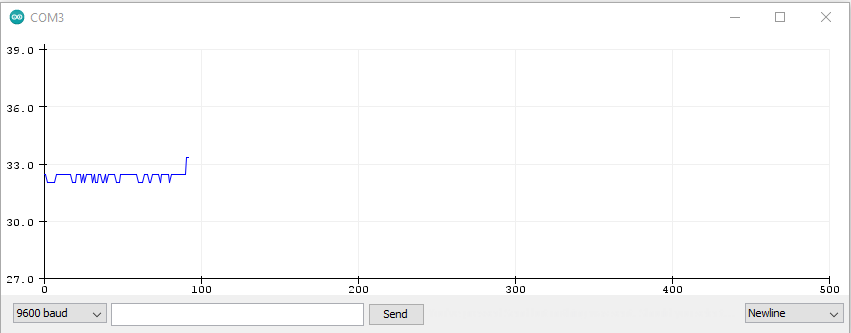
There is also an option to present the values graphically. We can do this by selecting the plotter from the menu (Tool -> Serial Plotter). The plotted graph looks like this:
In this article, we have seen how to make a very simple program and display several values in the console. Of course there are much more convenient ways to store and display values, but they are also more complicated. The board offers several wireless ways such as Bluethoot and WiFi, making it ideal for reading values from sensors without having a wired connection to the board. The optimized power consumption and its deep sleep capability also makes it ideal for tasks where low power consumption is needed.
Happy codding!